Amazon CloudWatch Database Insights vs Scandock
A comparison of Amazon CloudWatch Database Insights and Scandock on how monitoring is set up, how causes are found, setup steps and more.
As of November 3, 2026
Amazon CloudWatch Database Insights is the monitoring feature for Amazon RDS and Amazon Aurora. It succeeds Performance Insights, which reached end of life on July 31, 2026, and shows database load (DB load) broken down by wait event and by SQL. It has a Standard mode and an Advanced mode.
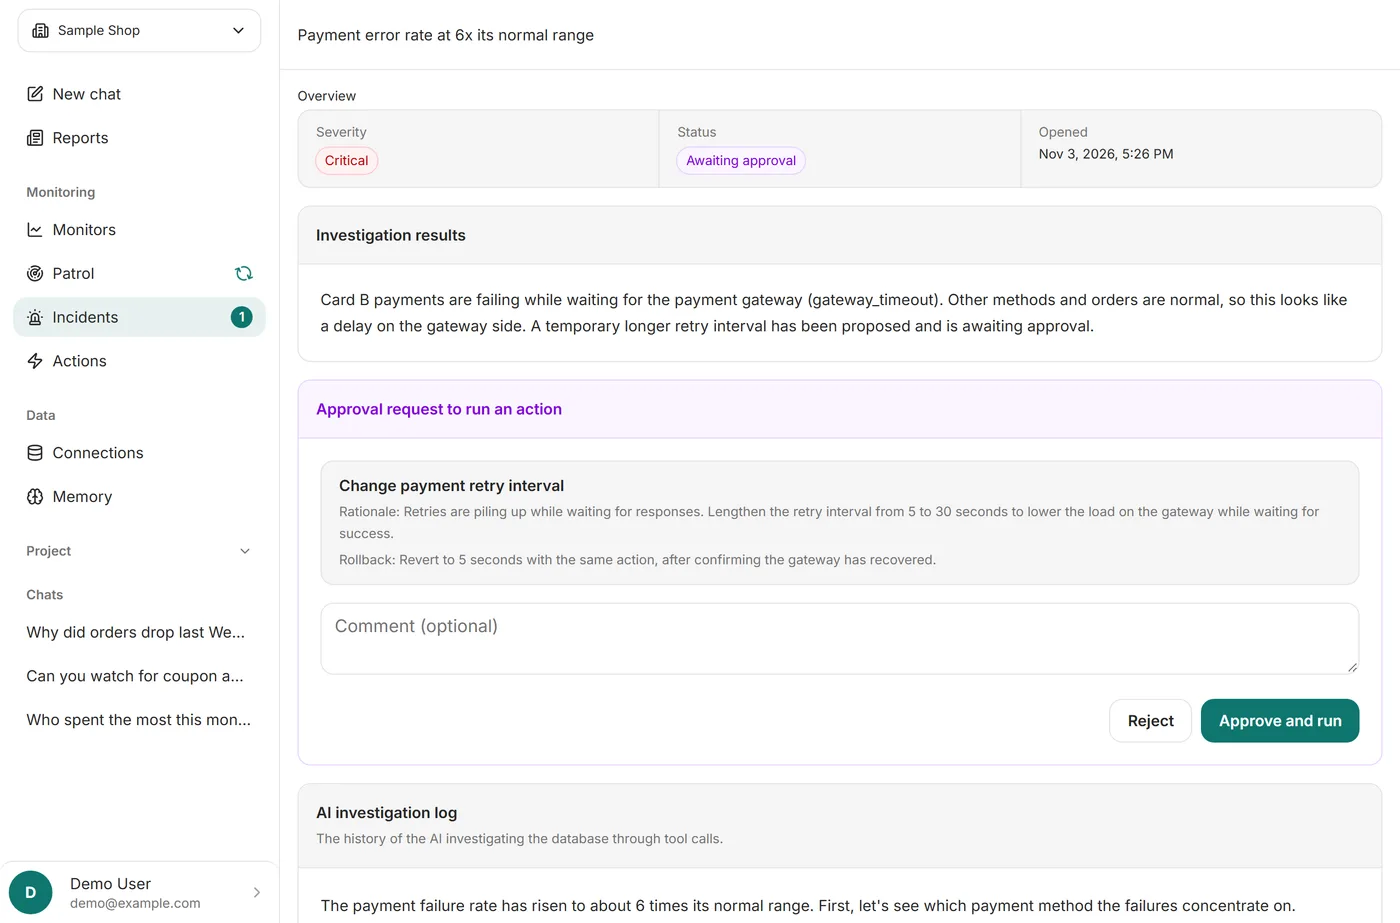
Scandock is a service focused on database monitoring. AI reads your tables and data to decide what to watch, and when something is off, it investigates the cause and tells you with evidence and a proposed fix. All you add to get started is a connection string.
The two watch different things. Database Insights watches performance such as DB load and CPU, and people set the thresholds and read the screens. Scandock watches business data inside the database, such as orders and payments, and AI investigates the cause of anomalies. If you run RDS or Aurora, Database Insights comes with it, so there is no need to drop it. This page puts real screens from both side by side and explains what each one covers.
In short
We recommend splitting the work, with Database Insights for RDS / Aurora performance and Scandock for business data and root-cause analysis.
Database Insights is good for watching DB load and heavy SQL, but it does not look at business data such as orders and payments, and people set alarm thresholds and read the screens at every incident. Adding Scandock lets you notice anomalies in business data and get all the way to the cause and a proposed fix, with no threshold tuning. You start by adding a connection string, and your Database Insights setup stays as it is.
How the roles differ
| Item | CloudWatch Database Insights | Scandock |
|---|---|---|
| What it covers | RDS / Aurora performance (DB load, CPU, connections, heavy SQL and so on) | Business data inside the database (orders, payments, jobs and so on) and the cause of anomalies |
| Designing what to monitor | Prebuilt dashboards show performance metrics. People decide what to alarm on | AI reads your tables and data and decides |
| Detecting anomalies | People set alarm thresholds (or anomaly detection bands) | AI judges from trends and past outcomes |
| Finding the cause | People read DB load and Top SQL. In Advanced mode, people choose a period to produce a machine-learning analysis report | AI runs queries to investigate and notifies you with evidence |
| Remediation | People act on it. To automate, people wire alarms to Lambda or Systems Manager actions | AI proposes a fix, and registered actions run after you approve them |
| Setup | Standard mode is on by default for RDS / Aurora. Advanced mode requires modifying the database. Slow query logs and notifications are set up separately | Just add a connection string |
| Business data monitoring | Not covered (you have to build your own pipeline to publish custom metrics) | AI also watches order counts, payment failures and more |
| Supported databases | RDS / Aurora engines, plus self-managed PostgreSQL on EC2 | PostgreSQL, MySQL, MariaDB, SQL Server, TiDB, D1, BigQuery (also RDS, Neon, Azure SQL Database, Cloud SQL and more) |
| Notifications | Amazon SNS topics (email and more) | Slack, email, Teams, LINE WORKS, LINE, Chatwork, kintone, Webhook and more |
What gets watched: database performance or business numbers
CloudWatch Database Insights
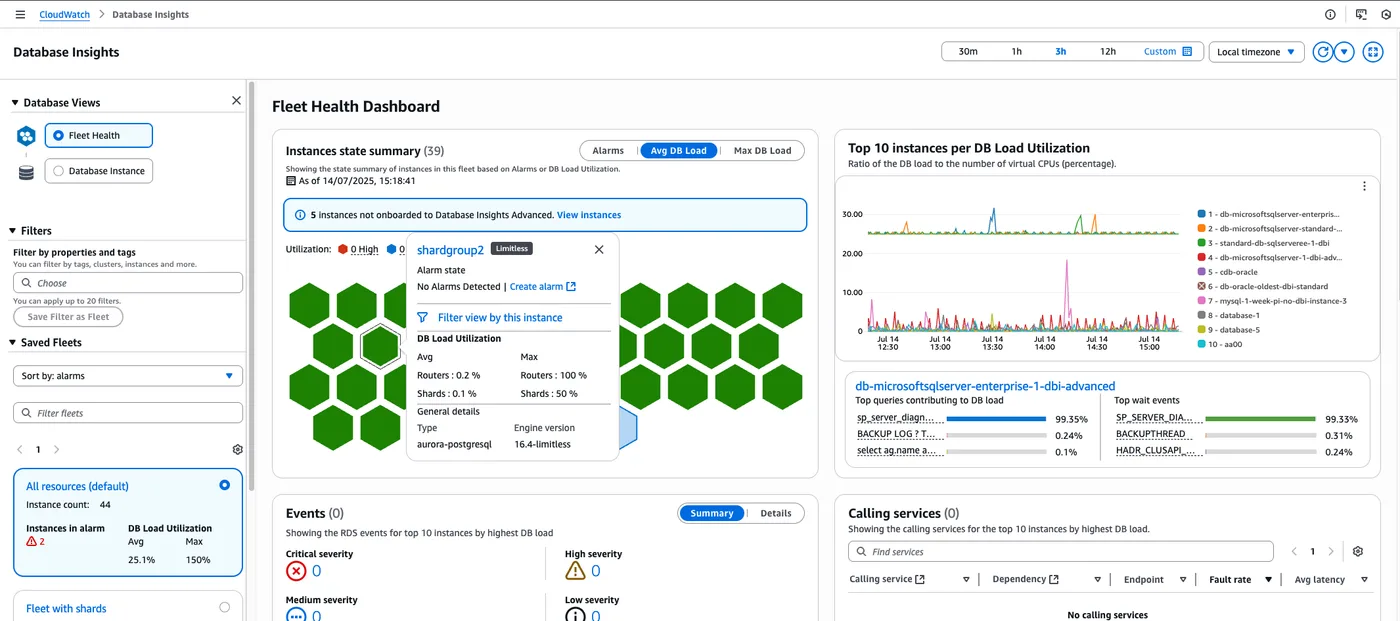
Database Insights shows performance metrics such as DB load, CPU, memory, connections and IOPS on prebuilt dashboards. For notifications, people create CloudWatch alarms and choose the metric, condition, threshold and how many periods must breach. It watches database performance only; business numbers such as order counts or payment success are not in scope.
Scandock
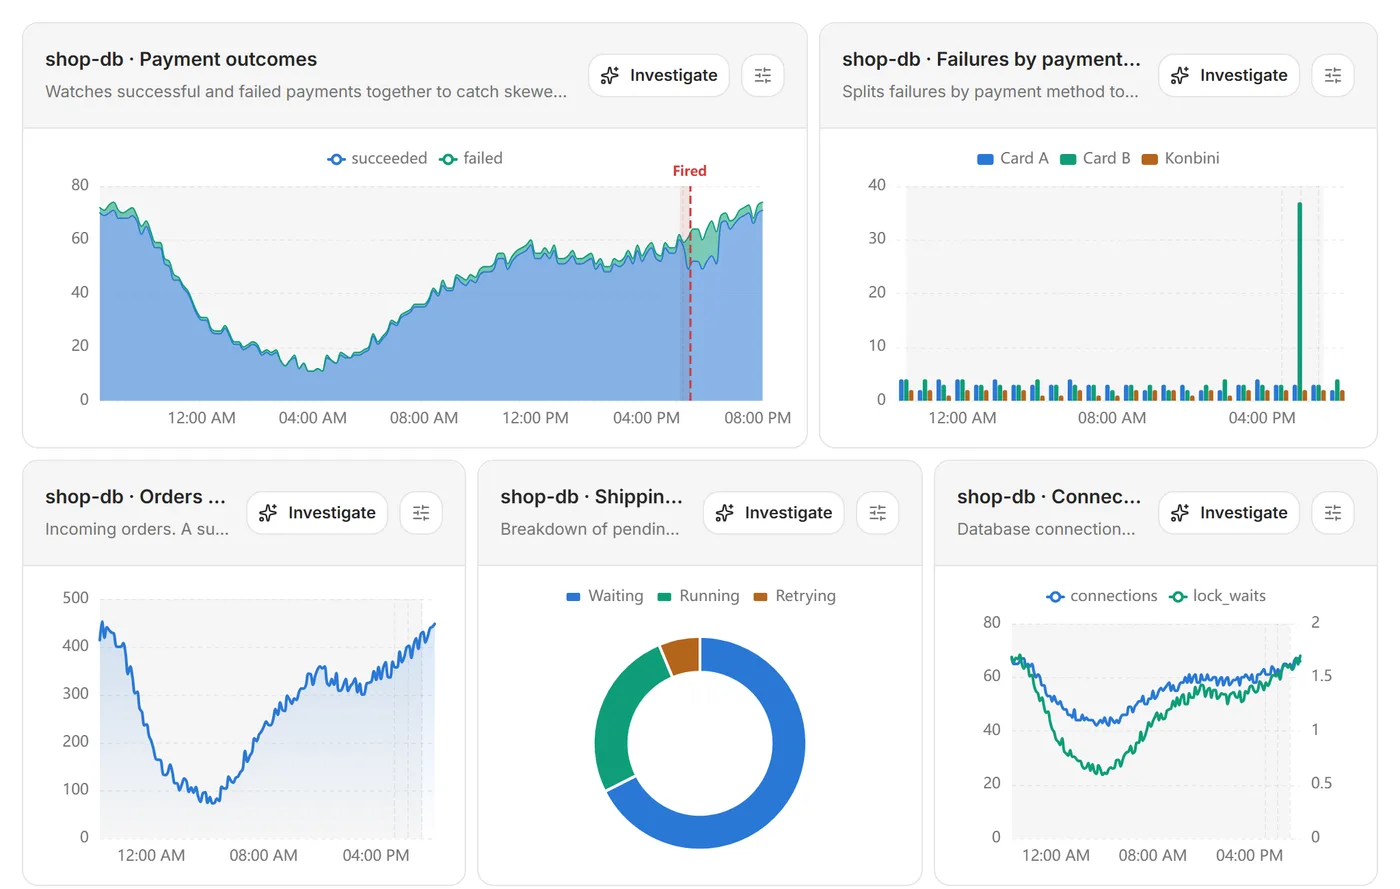
In Scandock, AI reads your tables and data and turns payment success, failures by payment method, incoming orders and stuck shipping jobs into monitors. No one has to set thresholds: AI judges anomalies from trends, marks them as fired and moves straight on to investigating the cause. Even when the database is not slow, it notices when business numbers look wrong.
Finding the cause: read the screens, or receive the answer
CloudWatch Database Insights
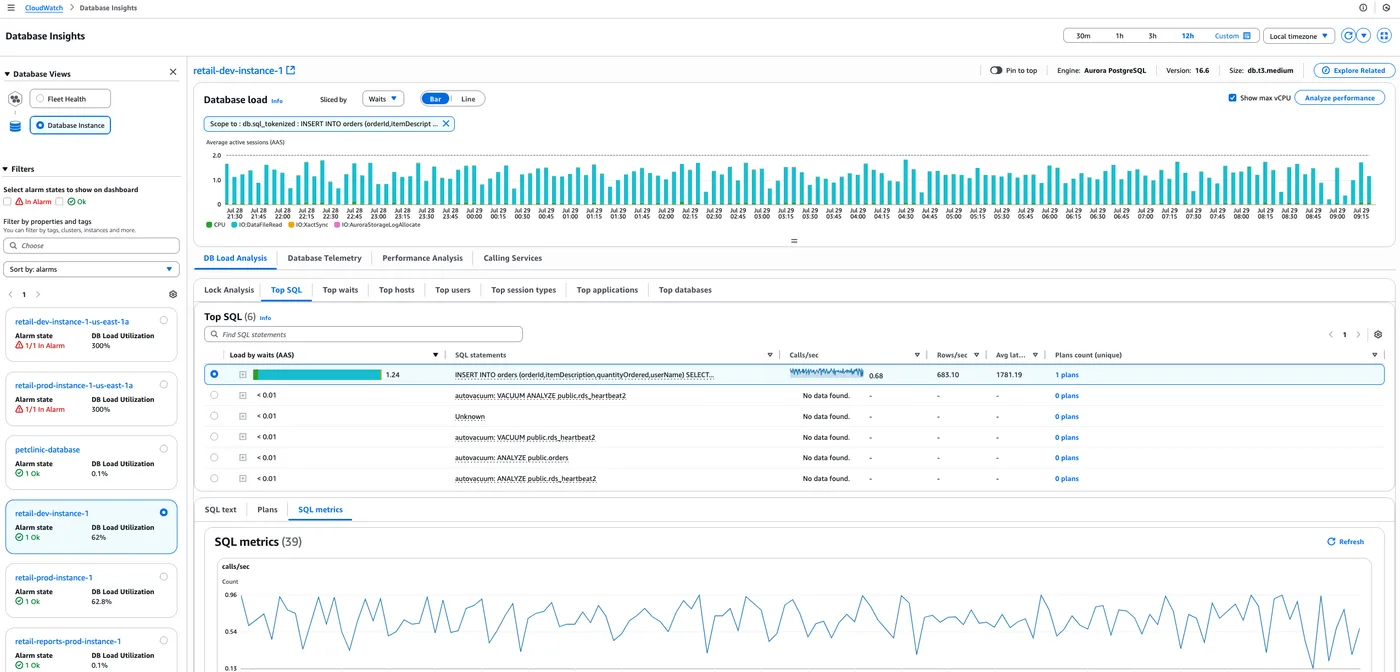
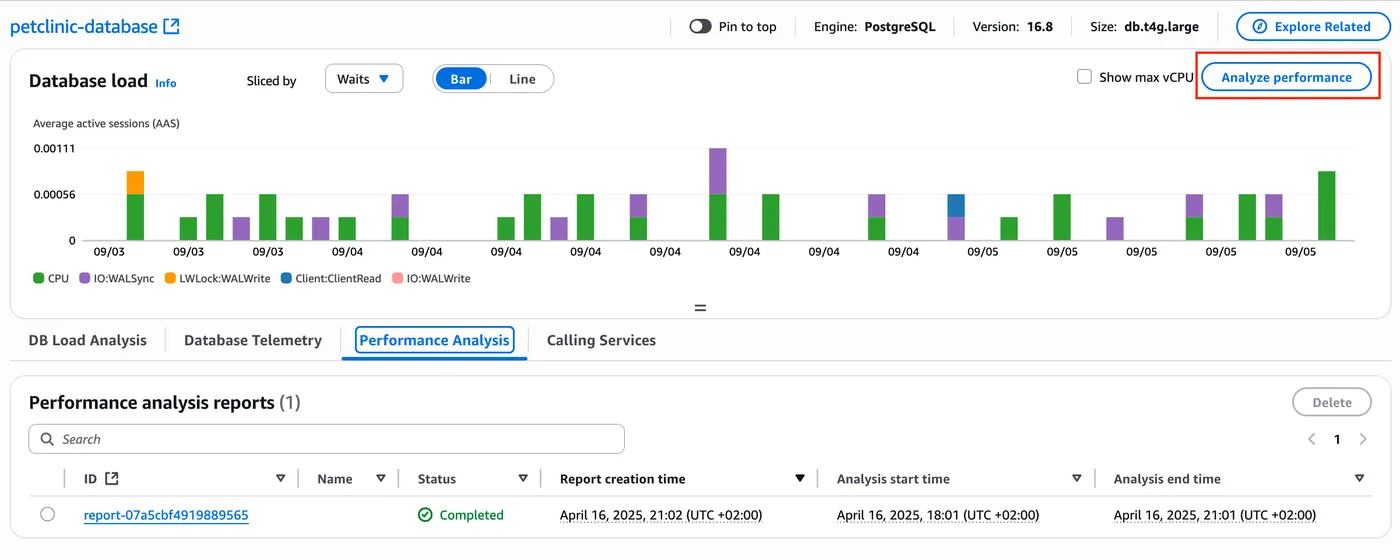
In Database Insights, people look for suspicious queries using DB load charts sliced by wait event or SQL, and the list of SQL statements with the most load (Top SQL). In Advanced mode, people choose a period and press "Analyze performance" to get a report in which machine learning looks for anomalies and bottlenecks. Both rely on people opening the screens and interpreting them. AWS also offers CloudWatch investigations, which uses generative AI to help with troubleshooting, but the data sources the official docs list are metrics, logs, change events, traces and similar telemetry, not the contents of your database tables.
Scandock
In Scandock, once AI notices an anomaly, it investigates the database with read-only queries. It summarizes what is happening and where, with evidence, and sends it to Slack or email along with a proposed fix. No one has to open screens to hunt for the cause; people read the report and decide whether to approve the fix.
Setup steps
We compare the case of monitoring Amazon RDS for PostgreSQL.
CloudWatch Database Insights
- Standard mode is already on for RDS / Aurora
- For Advanced mode, choose Modify on the database in the RDS console, select Advanced in the Database Insights section and apply (no downtime)
- To see slow queries, export database logs to CloudWatch Logs and set database parameters
- To see OS processes, turn on Enhanced Monitoring (charged separately)
- For notifications, create a CloudWatch alarm and choose the metric, condition, threshold and SNS topic
Scandock
- Paste a connection string (with an admin user, a read-only monitoring user is created for you)
- AI reads your tables and data, decides what to monitor and starts watching
Scandock installs nothing on the database server and does not change database settings. Databases not exposed to the internet can be connected through Cloudflare Tunnel.
How to use them together
Database Insights and Scandock are not connected automatically. You use their screens and notifications side by side, splitting the work like this.
- Watch performance changes such as DB load, CPU and connections with Database Insights dashboards and CloudWatch alarms.
- Let Scandock notice and report anomalies in business numbers, such as fewer orders, only payments failing or jobs piling up. It catches them even when the database is not slow.
- When a CloudWatch alarm fires, check whether Scandock has fired monitors or investigation results for the same time window. That tells you the impact on business data and points toward the cause.
- When a Scandock investigation finds a heavy query behind the problem, confirm how its load has changed in Database Insights Top SQL.
- Watch databases outside AWS, such as Neon, Cloud SQL, Azure SQL Database or BigQuery, with Scandock in the same place.
- Route notifications to the right people: performance alarms to email through SNS, business data anomalies to Slack, Teams, LINE, kintone and more.
Keep Database Insights as it is and add Scandock to try it out. It is free for 14 days: add a connection string and AI reads your business data and starts watching. It tells you, with the cause and a proposed fix, about problems that do not show up in performance metrics, like orders stopping while the database is fast, or only payments failing. Try it alongside the monitoring you already have.
Sources
- Amazon CloudWatch User Guide: CloudWatch Database Insights
- Amazon CloudWatch User Guide: Viewing the Fleet Health Dashboard
- Amazon CloudWatch User Guide: Viewing the Database Instance Dashboard
- Amazon CloudWatch User Guide: Monitoring Self-Managed Databases
- Amazon RDS User Guide: Turning on the Advanced mode of Database Insights
- Amazon CloudWatch User Guide: Create a CloudWatch alarm based on a static threshold
- Amazon CloudWatch User Guide: CloudWatch investigations
CloudWatch Database Insights features, steps and screens were checked on the official AWS site on November 3, 2026. Please check the official site for the latest information. Amazon CloudWatch, Amazon RDS and Amazon Aurora are trademarks of Amazon.com, Inc. or its affiliates.