Mackerel vs Scandock
A comparison of Mackerel and Scandock on how monitoring is set up, how causes are found, setup steps and more.
As of November 3, 2026
Mackerel is a Japanese server monitoring service run by Hatena Co., Ltd. You install mackerel-agent on your servers to collect metrics, view them as graphs and raise alerts with monitoring rules. Databases are covered by agent plugins (mackerel-plugin-mysql, mackerel-plugin-postgres and others) or by the AWS integration for Amazon RDS.
Scandock is a service focused on database monitoring. AI reads your tables and data to decide what to watch, and when something is off, it investigates the cause before telling you.
Both help you notice database problems, but they differ in who builds the monitoring and who investigates the cause. In Mackerel, people set the thresholds and people read the graphs to find the cause. In Scandock, AI does both. This page puts screens from both side by side to show the difference.
In short
If you want database monitoring and investigation handled for you, we recommend Scandock.
AI takes over setting and tuning thresholds and comparing graphs to find the cause. You start by registering a connection string, and it also watches anomalies in business data such as orders and payments. If your main goal is watching servers and containers, and you have people who can set thresholds and investigate causes themselves, Mackerel is enough.
Comparison table
| Item | Mackerel | Scandock |
|---|---|---|
| Designing monitors | You install plugins and create monitoring rules | AI reads your tables and data and decides |
| Detecting anomalies | You set Warning and Critical thresholds (machine-learning anomaly detection is also available for server system metrics) | AI judges from trends and past outcomes |
| Investigating the cause | You compare graphs yourself | AI runs queries to investigate and notifies you with evidence |
| Remediation | You fix things by hand | Registered actions run after you approve them |
| Setup | Install the agent and plugins on the DB server and edit the config file | Register a connection string |
| Business data monitoring | Write your own program to post metrics | AI also watches order counts, failed payments and more |
| Coverage | Servers, containers, cloud, logs, traces and more | Databases only |
What to watch: thresholds set by people or by AI
Mackerel
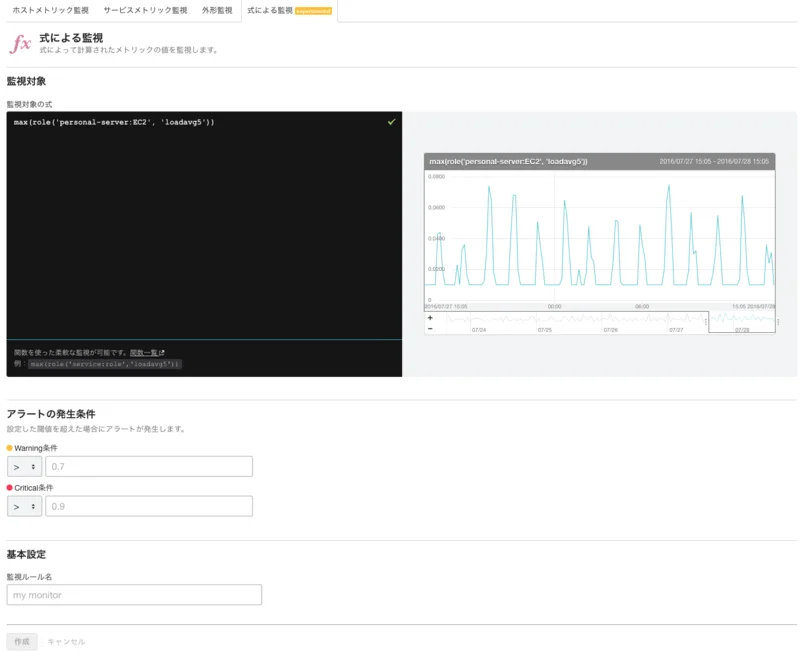
In Mackerel, you choose the metric and the Warning and Critical thresholds for each monitoring rule. You can also set how many points to average and how many consecutive breaches raise an alert. The database plugins collect numbers such as connections, commits and rollbacks, and deadlocks. Deciding how far each number can move before it becomes a problem, and turning that into a threshold, is up to you.
Mackerel also offers anomaly detection for roles, which uses machine learning to spot unusual behavior. It covers system metrics such as CPU and memory collected by mackerel-agent, and does not cover the database plugin metrics (custom metrics).
Scandock
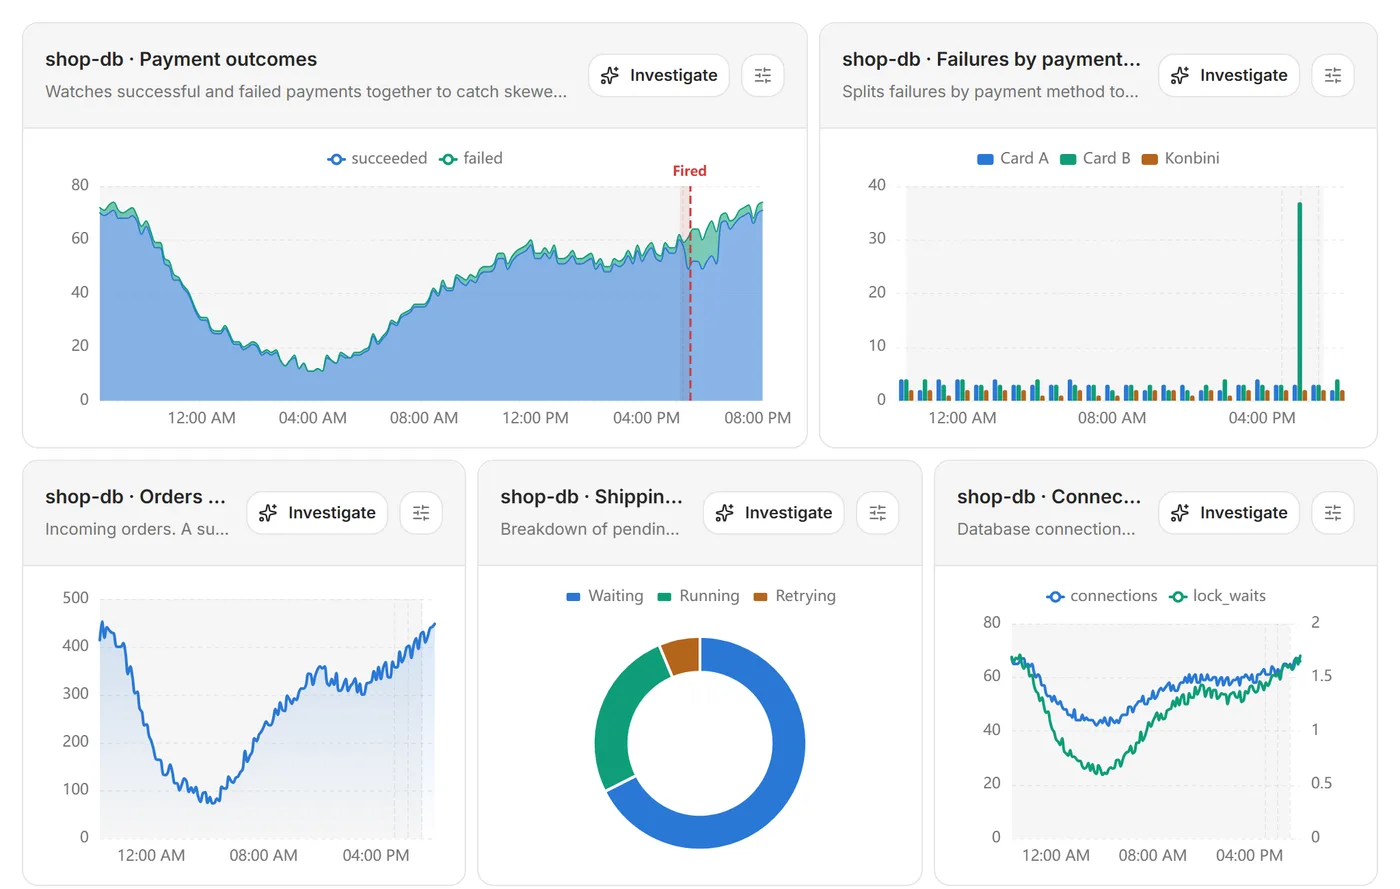
In Scandock, AI reads your tables and data and turns things like payment success, failures by payment method, incoming orders and backed-up shipping jobs into monitors. There are no thresholds: it judges anomalies from trends, marks them as fired and moves straight on to investigating the cause.
Finding the cause: reading graphs or receiving an answer
Mackerel
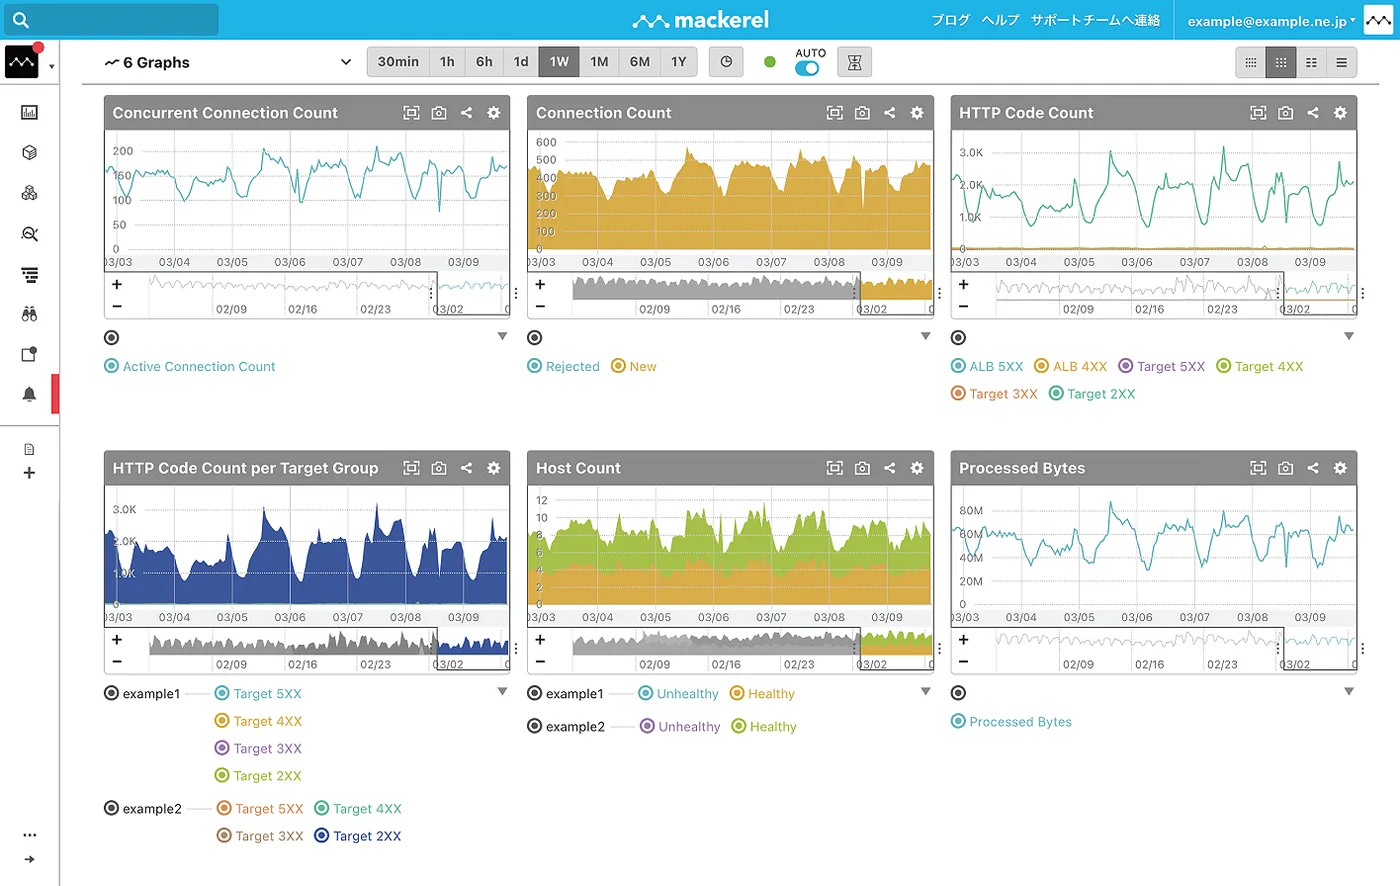
In Mackerel, when an alert arrives, you open the host or role graphs and compare them to see what changed and when. The graphs do not tell you which query or which data caused the problem. Digging into the database is left to you.
Scandock
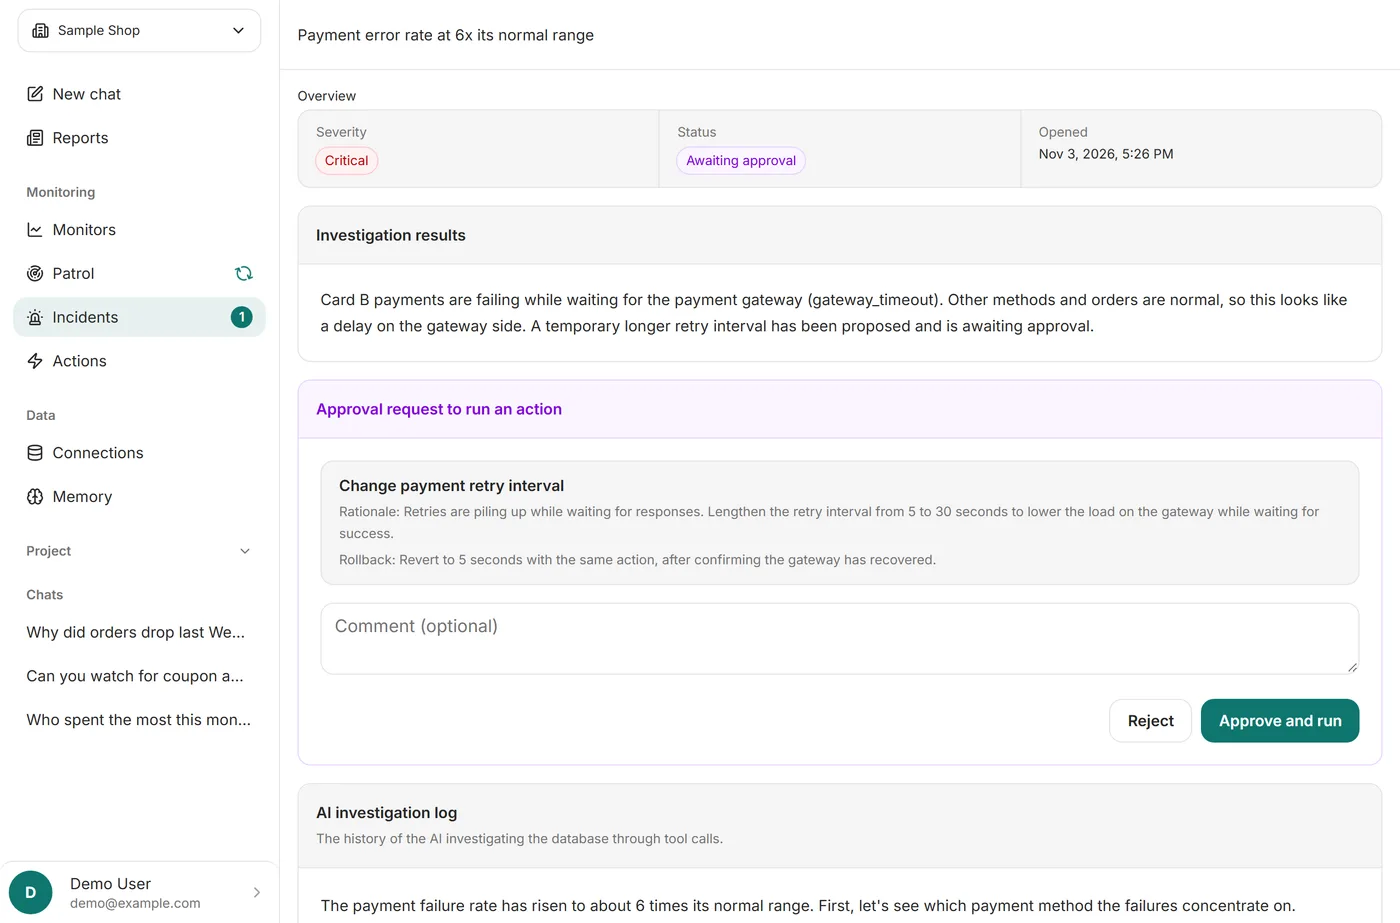
In Scandock, once AI notices an anomaly, it investigates the database with read-only queries. It summarizes what is happening and where, with evidence, and sends it to Slack or email along with suggested fixes. You read it and decide whether to approve.
Setup steps
Compared for monitoring a self-hosted PostgreSQL database.
Mackerel
- Install mackerel-agent on the database server
- Install the official plugin package (mackerel-agent-plugins) with yum or apt
- Create a monitoring user with the pg_monitor role (PostgreSQL 10 or later)
- Add [plugin.metrics.postgres] with the user name and password to mackerel-agent.conf and restart the agent
- Create monitoring rules in the UI and set a threshold for each metric
For Amazon RDS, you use the AWS integration instead of the agent. You create an IAM role in AWS, attach read-only policies and register it in Mackerel. It collects CloudWatch metrics, and you still create the monitoring rules yourself.
Scandock
- Paste and register a connection string (with an admin user, a read-only monitoring user is created automatically)
- AI reads your tables and data, decides on monitors and starts watching
Scandock installs nothing on your database server and does not change database settings. Databases that are not publicly reachable can be connected through Cloudflare Tunnel.
Which one to choose
Mackerel is enough if you
- Mainly need to watch servers, containers and cloud resources, and metrics such as connection counts are enough for your databases
- Have people who can keep setting and tuning thresholds and investigate the database themselves when an alert fires
Scandock is a good fit if you
- Have no database expert, or they are stretched thin
- Want to stop setting and tuning thresholds
- Want anomalies in business data, such as order counts and failed payments, watched too
- Want to spend less time finding the cause after an alert
- Want notifications in LINE, Microsoft Teams, kintone and more
In Mackerel, building monitoring rules and finding out what happened inside the database are both work for people. With Scandock, AI designs the monitoring, investigates the cause of an anomaly, notifies you with evidence and runs the fix once you approve it. You can also keep Mackerel for servers and hand database and business data monitoring to Scandock. It is free for 14 days, and it starts watching as soon as you register a connection string.
Sources
- Mackerel ヘルプ: 監視・通知を設定する
- Mackerel ヘルプ: 式による監視をおこなう
- Mackerel ヘルプ: ロール内異常検知による監視をおこなう
- Mackerel ヘルプ: ミドルウェアのメトリック可視化に公式プラグイン集を使う
- Mackerel ヘルプ: mackerel-plugin-postgres
- Mackerel ヘルプ: AWS インテグレーション
- Mackerel ヘルプ: AWS インテグレーション - Amazon RDS
- Mackerel 公式サイト
Mackerel setup steps and screens were checked on the official site on November 3, 2026. Check the official site for the latest information. Mackerel is a trademark of Hatena Co., Ltd.