New Relic vs Scandock
A comparison of New Relic and Scandock on how monitoring is set up, how causes are found, setup steps and more.
As of November 3, 2026
New Relic is a monitoring platform that covers APM, infrastructure, logs and more. For databases, the APM Databases page shows query time as seen from your app, and the PostgreSQL and MySQL integrations (via the infrastructure agent) show database-side metrics and query performance.
Scandock is a service focused on database monitoring. AI reads your tables and data to decide what to watch, and when something is off, it investigates the cause before telling you.
Both help you notice database problems, but in New Relic people write the monitoring conditions and people read the screens to find the cause. In Scandock, AI does both. This page puts real screens from both side by side to show the difference.
In short
If you want database monitoring and investigation handled for you, we recommend Scandock.
AI decides what to monitor, and when something is off, it investigates the cause and reports with evidence. You start by adding a connection string, and it also watches business data such as orders and payments. New Relic is enough if you need your app and database together with APM at the center, and have people in-house who write and keep tuning monitoring conditions.
Comparison table
| Item | New Relic | Scandock |
|---|---|---|
| Designing monitors | You write alert conditions (queries) | AI reads your tables and data and decides |
| Detecting anomalies | You choose static, anomaly or outlier thresholds and set sensitivity and duration | AI judges from trends and past outcomes |
| Finding the cause | You read the Databases page and slow query lists | AI runs queries to investigate and reports with evidence |
| Remediation | Done by people | Registered actions run after your approval |
| Setup | Infrastructure agent and integration, a monitoring user, extensions | Add a connection string |
| Business data | Write custom query config yourself | AI also watches orders, failed payments and more |
| Scope | Covers APM, infrastructure, logs and more | Focused on databases |
| Price | Based on users and data volume (1 user and 100 GB/month free) | From ¥29,800/month (3 databases, 5 users) |
What to watch: conditions set by people, or by AI
New Relic
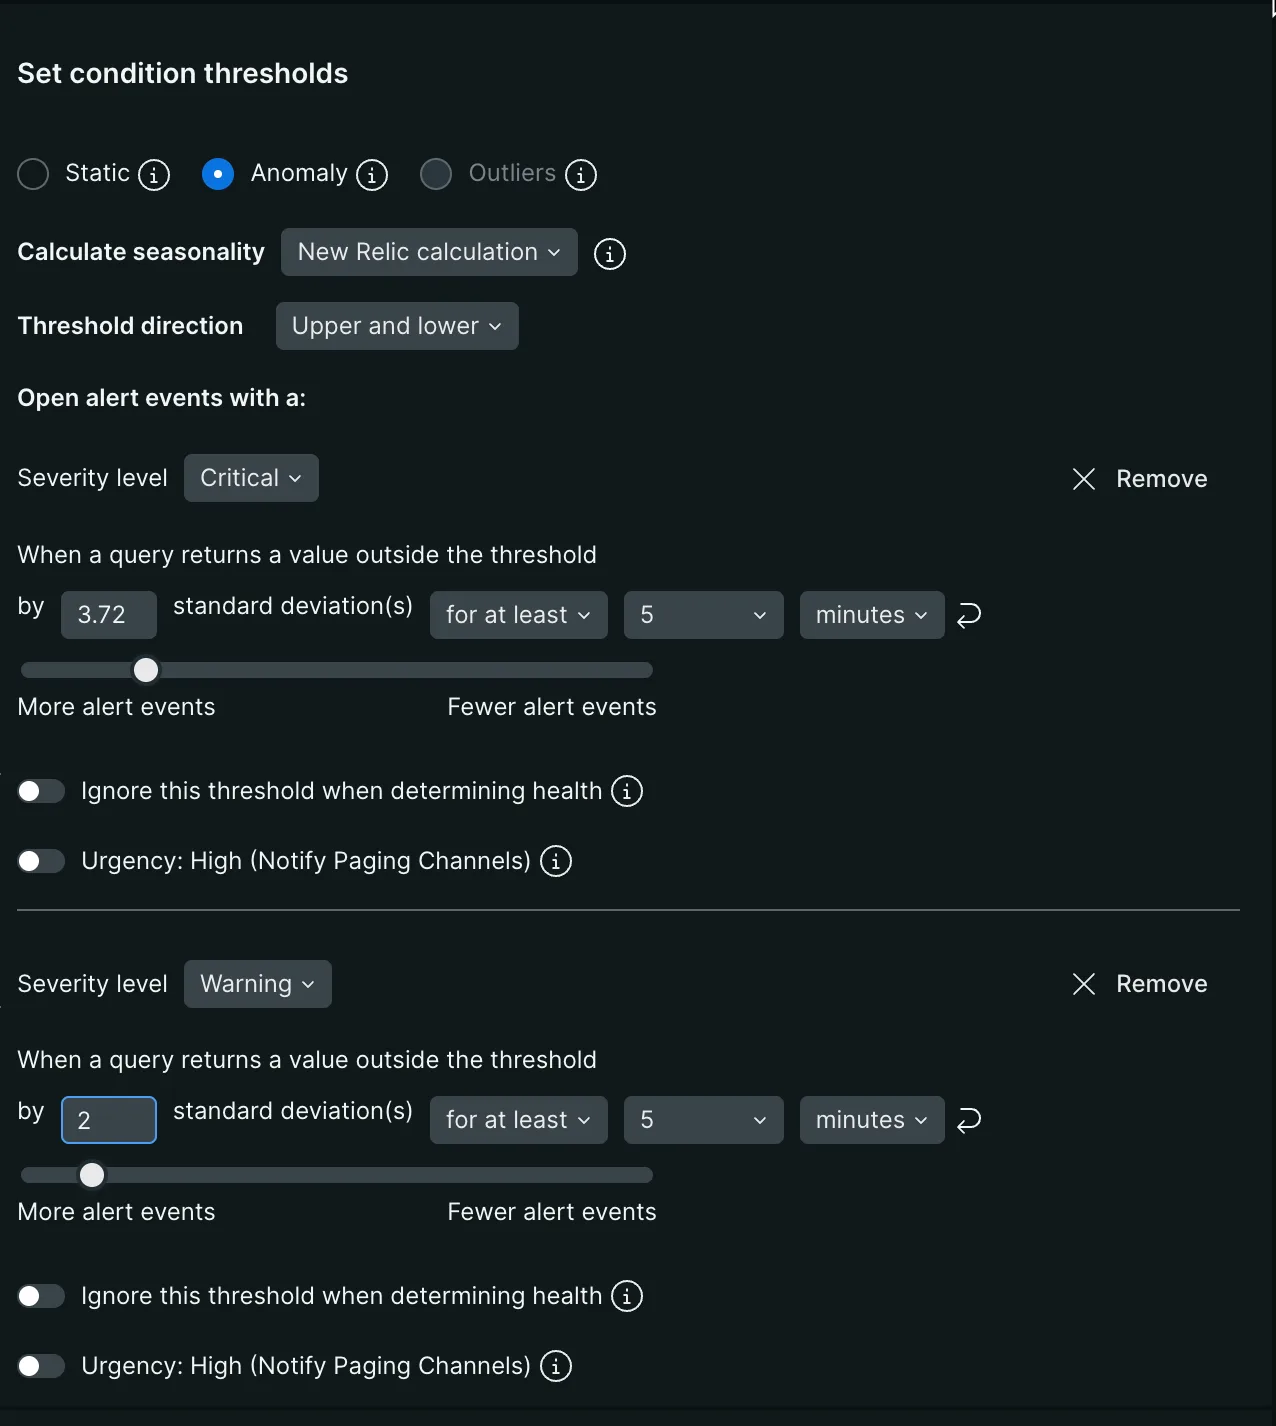
In New Relic, each alert condition uses a query to pick the data, and you choose static, anomaly or outlier thresholds. Even with anomaly detection, a person decides how many standard deviations and for how many minutes should trigger an alert, and how to split warning and critical levels. To watch business data, you also write custom query config yourself. It takes someone who knows which data matters to the business and keeps tuning the conditions.
Scandock
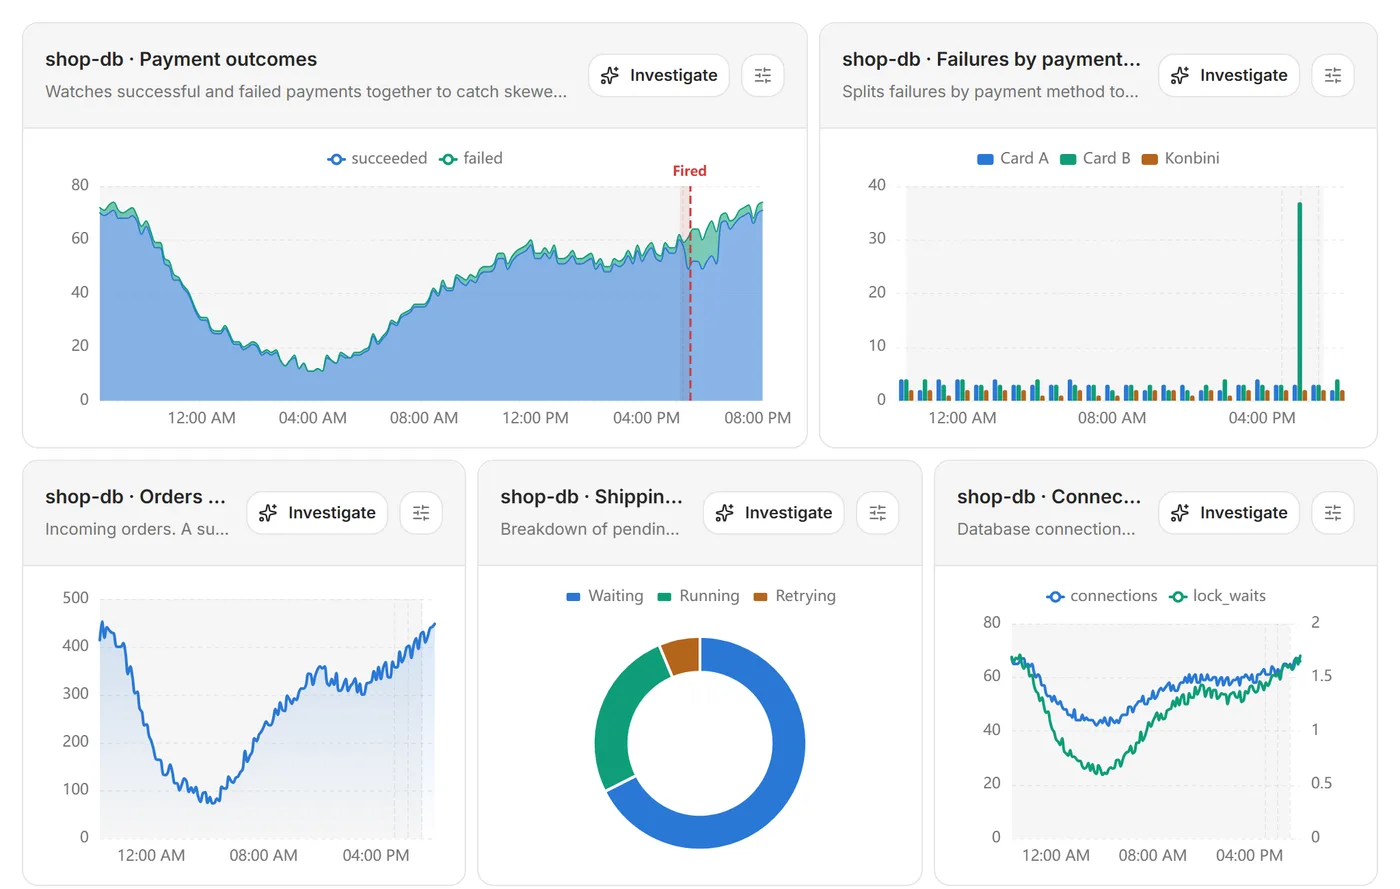
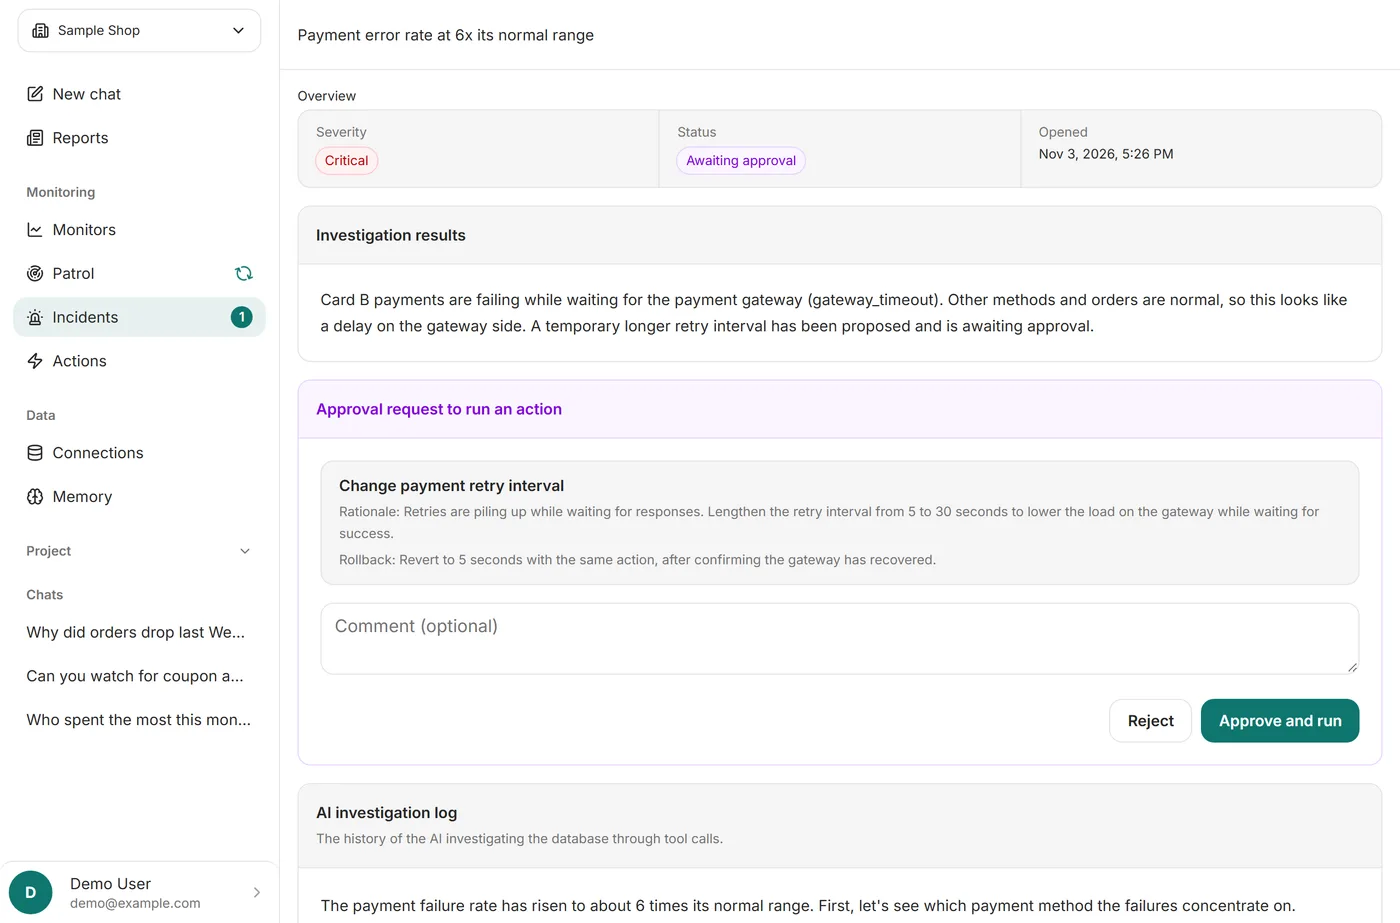
In Scandock, AI reads your tables and data and sets up monitors such as payment outcomes, failures by payment method, incoming orders and backed-up shipping jobs. Nobody has to write conditions or set thresholds. AI judges anomalies from trends, marks them as fired, and moves straight on to investigating the cause.
Finding the cause: read the screens, or get the answer
New Relic
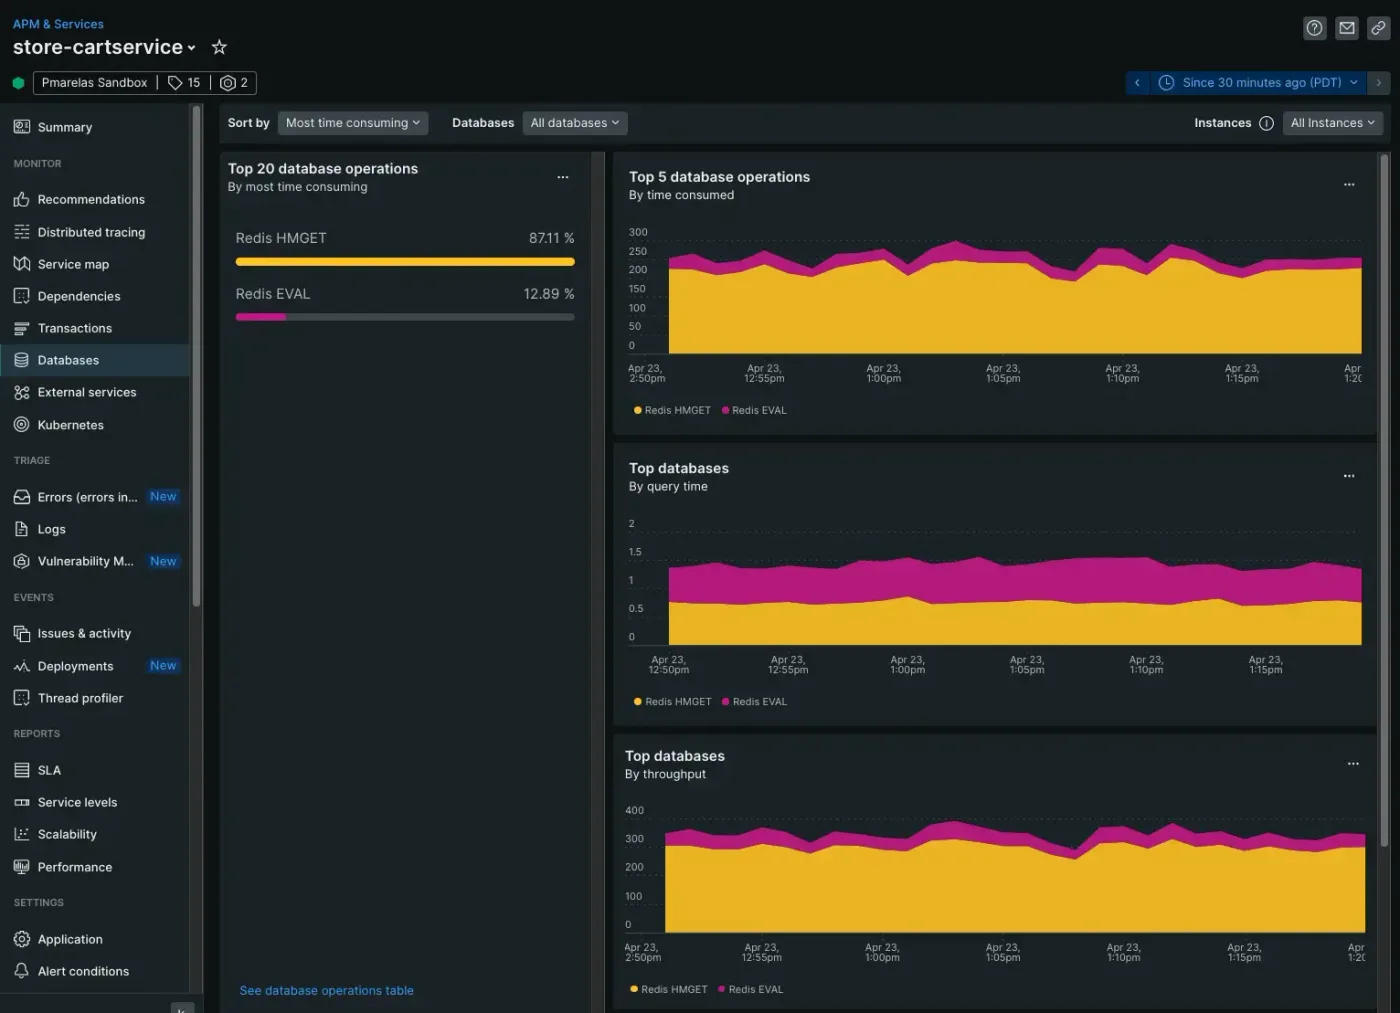
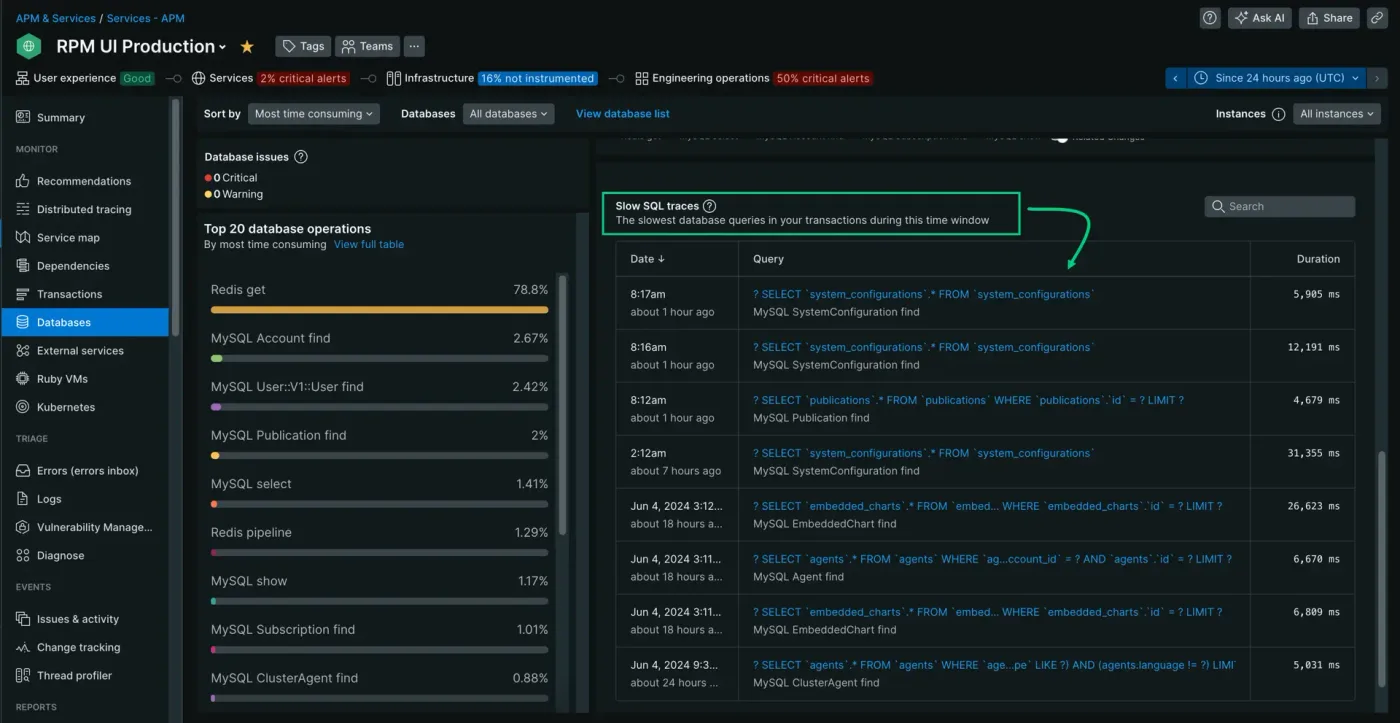
In New Relic, the APM Databases page shows the most time-consuming database operations and trends in query time and throughput per database. From there you open the slow query list to see which queries took how long. With the PostgreSQL or MySQL integration, you also get dashboards for query performance and wait events from the database side. Deciding which screen to check and pinning down the cause is up to people.
Scandock
In Scandock, when AI notices an anomaly, it investigates with read-only queries, summarizes what is happening with evidence, and sends it to Slack or email with a suggested fix. Nobody has to dig through screens. You read the result and decide whether to approve the fix.
Setup
Compared for a self-hosted PostgreSQL database on Linux, including query performance monitoring.
New Relic
- Install the infrastructure agent and the PostgreSQL integration (nri-postgresql) on a host that can reach the database
- Create a new_relic monitoring user and grant pg_read_all_stats and other privileges
- Install the pg_stat_statements, pg_stat_monitor and pg_wait_sampling extensions, add them to shared_preload_libraries in postgresql.conf, restart the database and run CREATE EXTENSION
- Create postgresql-config.yml in /etc/newrelic-infra/integrations.d with the connection details and ENABLE_QUERY_MONITORING
PostgreSQL 12 or later is required. To use the APM Databases page, you also install an APM agent in your app.
Scandock
- Paste a connection string (with an admin user, a read-only monitoring user is created for you)
- AI reads your tables and data, decides what to monitor and starts watching
Scandock installs nothing on the database server and changes no database settings. Private databases connect through Cloudflare Tunnel.
Pricing
New Relic is priced by the number of people using the screens (full platform users) and the amount of data ingested, not by the number of databases. So this compares cost by number of users. Each Scandock plan has a user limit: up to 5 on Starter and up to 20 on Business.
- New Relic (full platform users)
- Scandock
| Users | 1 | 2 | 3 | 4 | 5 | 6 | 7 | 8 | 9 | 10 |
|---|---|---|---|---|---|---|---|---|---|---|
| New Relic (full platform users) | 1,500 | 16,350 | 31,200 | 46,050 | 60,900 | 376,920 | 439,740 | 502,560 | 565,380 | 628,200 |
| Scandock | 29,800 | 29,800 | 29,800 | 29,800 | 29,800 | 79,800 | 79,800 | 79,800 | 79,800 | 79,800 |
Amounts are monthly, in yen, excluding tax.
- New Relic is calculated with data ingest within the free 100 GB a month. Up to 5 users is Standard (first user ¥1,500, each additional ¥14,850). From 6 users, Standard's limit is exceeded, so Pro pay-as-you-go applies (¥62,820 per user). List prices ($10, $99, $418.80) are converted at ¥150 to the dollar. Pro with an annual commitment is $349 (¥52,350) per user.
- Data beyond 100 GB a month costs $0.40 (¥60) per GB on New Relic. APM, log and infrastructure data all count toward this.
- On New Relic, the APM and infrastructure screens are for full platform users. Free basic users cannot use them.
- Scandock is Starter (¥29,800/month, up to 3 databases and 5 users) or Business (¥79,800/month, up to 10 databases and 20 users). Each plan limits the number of monitors and the check interval. Annual billing saves two months. Alerts go to Slack channels or email addresses, so people who only receive them are not counted.
Which one to choose
New Relic is enough for teams that
- Need app, database, infrastructure and logs on the same screen, with APM at the center
- Have people in-house who write monitoring conditions and read the screens to find the cause at every incident
Scandock fits teams that
- Have no database expert, or no time to spare
- Want to stop writing and tuning alert conditions
- Want anomalies in business data, like orders and failed payments, watched too
- Want monitoring costs to stay flat as users and data grow
- Want alerts in Slack, Microsoft Teams, Google Chat and more
Monitoring databases with New Relic takes people's time: writing conditions, tuning sensitivity and reading screens at every incident. Those hours never show up on the price list. With Scandock, AI designs the monitoring, investigates the cause, reports with evidence, and runs fixes once you approve them. It is free for 14 days and starts watching as soon as you add a connection string. Give Scandock a try.
Sources
- New Relic Pricing
- New Relic Docs: User types
- New Relic Docs: PostgreSQL monitoring integration
- New Relic Docs: Query performance monitoring
- New Relic Docs: Anomaly detection
- New Relic Docs: Databases page
- New Relic Docs: Diagnose slow database queries
- New Relic Docs: View slow query details
New Relic pricing, setup steps and screenshots were checked on its official site on November 3, 2026. Prices are the US dollar list prices on the English pricing page. See the official site for the latest. New Relic is a trademark of New Relic, Inc.