Zabbix vs Scandock
A comparison of Zabbix and Scandock on how monitoring is set up, how causes are found, setup steps and more.
As of November 3, 2026
Zabbix is open-source monitoring software. Besides servers, network devices and applications, it monitors databases such as MySQL and PostgreSQL with official templates. What it mainly watches are performance and availability values such as connections, slow queries and replication lag.
Scandock is a service focused on database monitoring. AI reads your tables and data and decides what to watch in business data such as orders, payments and jobs. When something is off, it investigates the cause and tells you, with evidence.
The two watch different things. Rather than choosing one, splitting the roles and using both fits how teams actually work. This page puts screens from both side by side to show what each one covers.
In short
Keep Zabbix, and add Scandock for business data and root-cause analysis.
Zabbix watches servers, networks and database availability. Scandock notices anomalies in business data, such as a drop in orders or a rise in payment failures, investigates the cause and delivers a suggested fix. Nobody has to set thresholds. All you need to start is a connection string, and nothing in your Zabbix setup changes. Fixes run only after a person approves them.
Who covers what
| Item | Zabbix | Scandock |
|---|---|---|
| Delivery | Open-source software you run on your own servers (Zabbix Cloud also exists) | Cloud service (SaaS) |
| Mainly watches | Performance and availability of servers, network devices, applications and databases | Business data inside the database (orders, payments, jobs and more) and the cause of anomalies |
| Designing monitors | You pick templates and configure items and triggers | AI reads your tables and data and decides |
| Detecting anomalies | Trigger expressions and thresholds you write | AI judges from trends and past outcomes |
| Investigating causes | Tells you which trigger fired. People read graphs and latest data to find the cause | AI runs queries to investigate and notifies you with evidence |
| Remediation | Done by hand (scripts can also be run automatically) | Registered actions run after you approve them |
| Setup | Build a Zabbix server, install Agent 2, create a monitoring user, configure templates and macros | Register a connection string |
| Business data | Write SQL yourself with ODBC or custom queries | AI also watches orders, payment failures and more |
| Cost | Software is free. Servers and operating effort cost money | From ¥29,800/month (up to 3 databases) |
What to watch: triggers you write, or AI decides
Zabbix
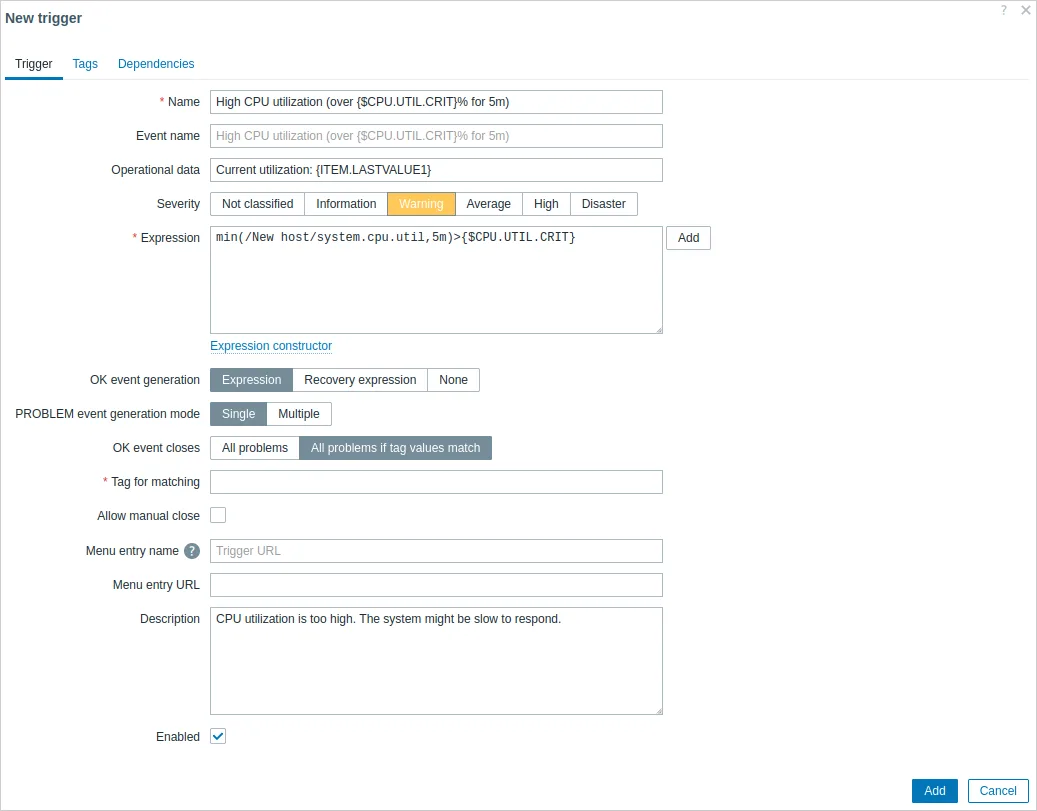
In Zabbix, you configure the values to collect (items) and the conditions that define a problem (triggers). The official MySQL and PostgreSQL templates include triggers for connections, slow queries, replication lag and more. The default thresholds may not fit your environment, so people tune them with macros after watching a few weeks of data. For business data such as order counts, you write the SQL and the trigger expressions yourself.
Scandock
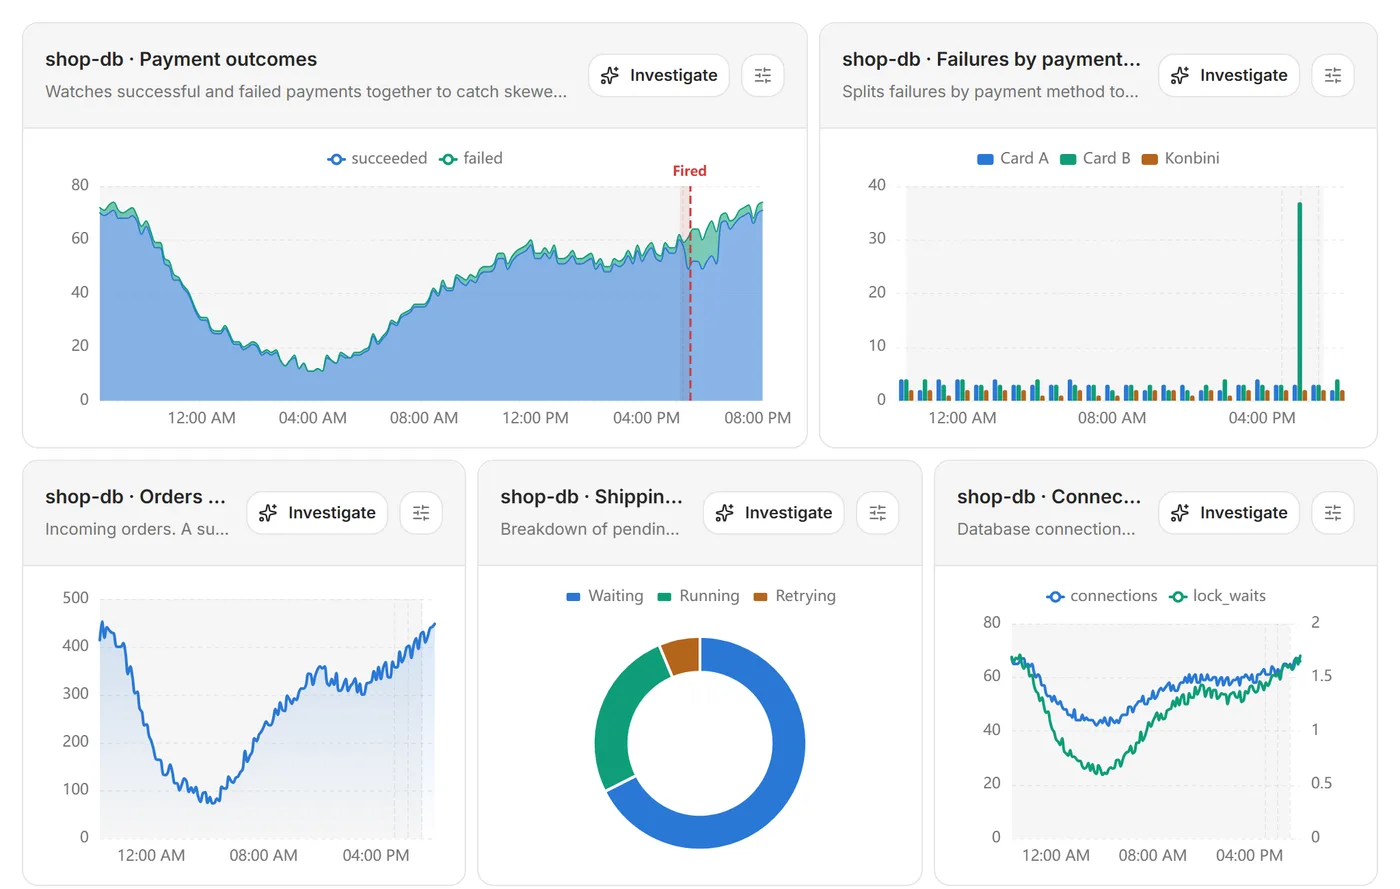
In Scandock, AI reads your tables and data and turns things like payment success, failures by payment method, incoming orders and shipping job backlogs into monitors. Nobody has to set thresholds. AI judges anomalies from trends, marks them as fired, and moves straight on to investigating the cause.
Finding the cause: reading screens, or getting an answer
Zabbix
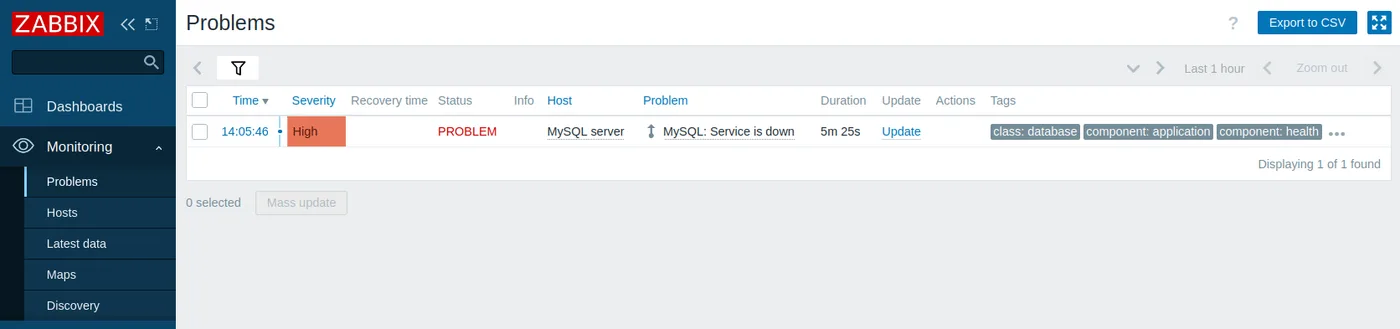
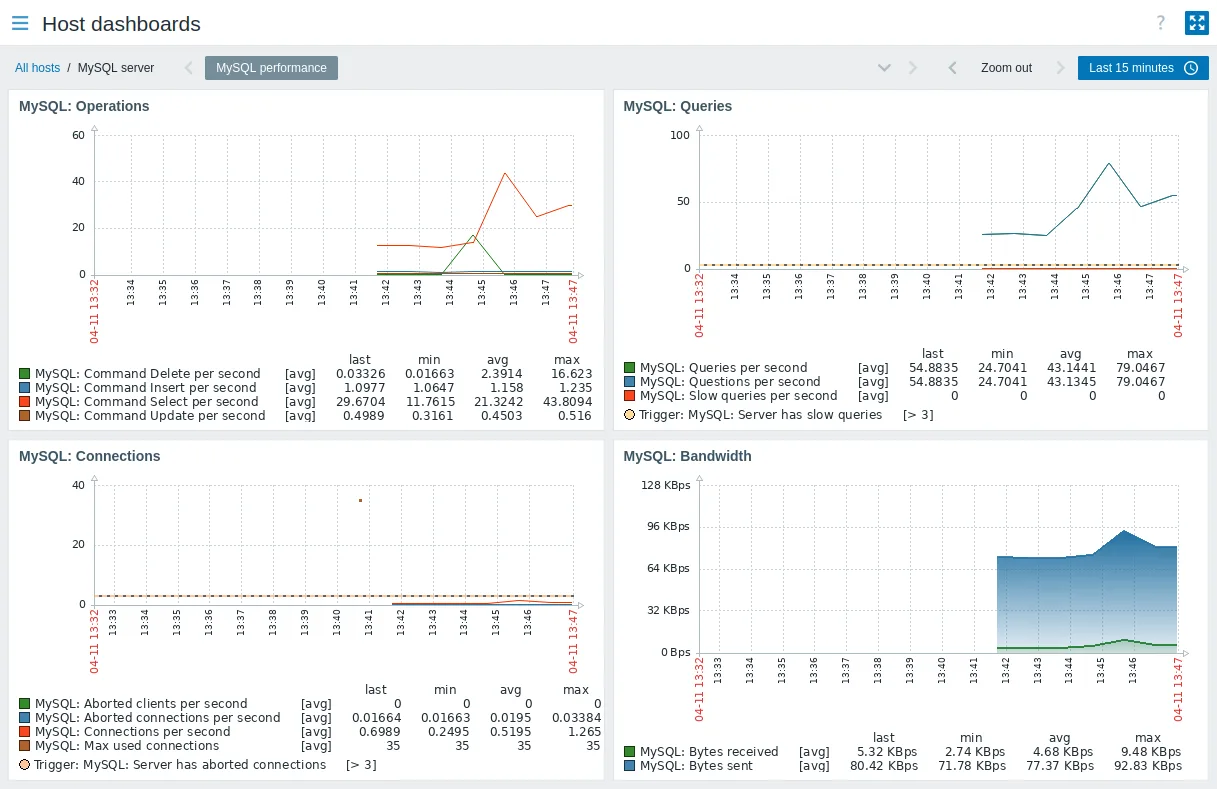
In Zabbix, when a trigger enters the problem state, it shows up in the Problems list and a notification goes out. That tells you which trigger fired, and no more. To find out why, someone opens graphs and latest data and interprets them, and if needed connects to the database and writes SQL.
Scandock
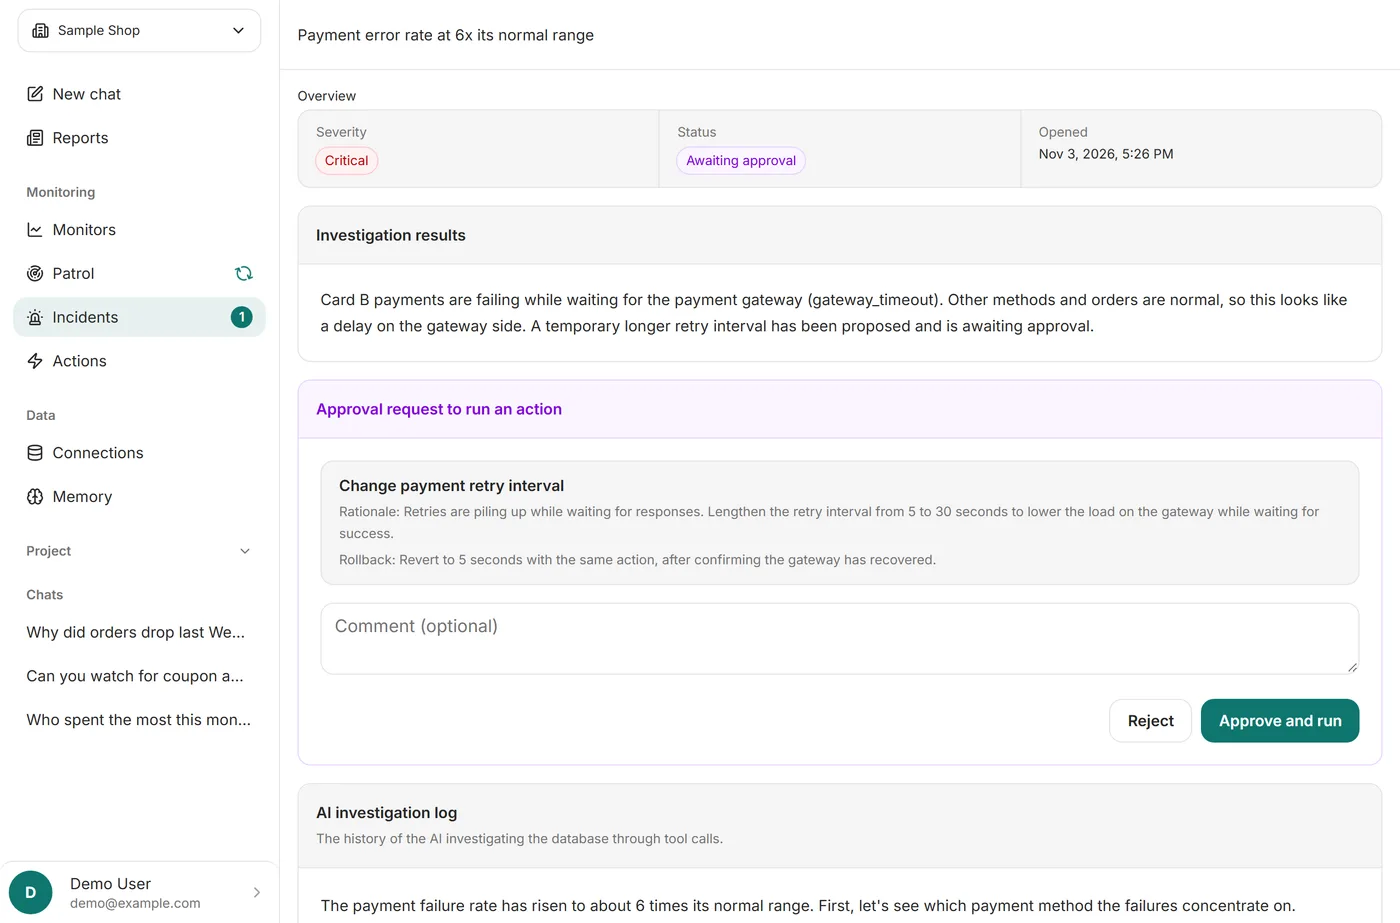
In Scandock, when AI notices an anomaly, it investigates the database with read-only queries. It summarizes what is happening where, with evidence, and sends it to Slack or email with a suggested fix. No one has to interpret graphs. You read the result and decide whether to approve the fix.
Setup steps
Comparing setup for a self-hosted PostgreSQL monitored with Zabbix agent 2 on Zabbix 7.0 (LTS).
Zabbix
- Set up the Zabbix server, web interface and the database Zabbix itself uses (not needed with Zabbix Cloud)
- Install Zabbix agent 2 and the PostgreSQL plugin package (zabbix-agent2-plugin-postgresql) on a host that can reach the database
- Create a zbx_monitor user, grant it the pg_monitor role, allow its connections in pg_hba.conf and reload the configuration
- Create a host in Zabbix, link the "PostgreSQL by Zabbix agent 2" template, and set the connection ({$PG.CONNSTRING.AGENT2}) and password ({$PG.PASSWORD}) macros
- Check that values arrive in Latest data, and configure where notifications go
- To watch business data too, write SQL with ODBC or Agent 2 custom queries and create triggers
Scandock
- Paste and register a connection string (with an admin user, a read-only monitoring user is created automatically)
- AI reads your tables and data, decides what to monitor, and starts watching
Scandock installs nothing on your database server and does not change database settings. Databases that are not public can be connected through Cloudflare Tunnel.
Cost
Zabbix software costs nothing. What to compare is the cost of the monitoring server and the time people spend building and running the monitoring.
| Item | Zabbix | Scandock |
|---|---|---|
| Software | ¥0 (no license fee) | Starter ¥29,800/month (up to 3 databases), Business ¥79,800/month (up to 10) |
| Monitoring server | You provide it. Zabbix Cloud starts at ¥7,500/month (Nano, 50 NVPS) | Not needed (included) |
| Official paid support | Optional. Silver ¥48,750/month, Gold from ¥123,750/month (both billed annually) | — |
| People's time | Server upgrades and maintenance, template and trigger setup, threshold tuning, investigating problems | Read the investigation results and decide whether to approve the fix |
- Zabbix prices are the dollar prices on the official site converted at ¥150 per dollar. Zabbix Cloud Nano starts at $50/month and includes 10GB of storage. NVPS is the number of new values received per second; the more you monitor, the larger the tier you need. The official site says prices are starting points and may vary with your configuration. Annual subscriptions save 10%.
- Zabbix paid support: Silver is $325/month (8x5, 1-day response, 8 cases), Gold is from $825/month (4-hour response, unlimited cases). You do not need a support contract just to use the software.
- Server costs for self-hosting vary widely with your setup and cloud provider, so no amount is given here.
- Scandock: Starter (¥29,800/month) covers up to 3 databases, Business (¥79,800/month) up to 10. Each plan has limits on the number of monitors and the judging interval. Paying annually gives you two months free.
How to use them together
Zabbix and Scandock run separately. Keep your Zabbix setup as it is and run Scandock alongside it.
What Zabbix covers
- Availability and performance of servers, network devices and applications
- Database availability and performance (connections, slow queries, replication lag and more)
- Monitoring that must stay entirely inside your own network
What adding Scandock covers
- Anomalies in business data inside the database, such as order counts, payment failures and job backlogs
- Designing business-data monitors and judging anomalies (no SQL, triggers or thresholds to write)
- Investigating the cause of anomalies and putting together a suggested fix
Running them side by side
- Business problems such as falling orders or rising payment failures can happen even when server values look normal. Scandock notices these and tells you.
- When a database problem fires in Zabbix, open the incident screen in Scandock too. If business data is affected, the cause AI found and a suggested fix are there.
- Scandock can send notifications to Slack, Microsoft Teams, LINE WORKS, kintone, webhooks and more. Send them to the channel your team already watches, and you can follow them next to your Zabbix alerts.
- If you have been writing SQL and triggers in Zabbix to watch business data, you can hand that part to Scandock.
Keep your current monitoring and add Scandock to try it. You do not need to change anything in Zabbix. The first 14 days are free, and AI starts watching your business data as soon as you register a connection string.
Sources
- Zabbix Technical Support (価格)
- Zabbix Cloud (価格)
- Zabbix 7.0 マニュアル: Zabbix エージェント 2 で MySQL を監視する
- Zabbix 7.0 Manual: Configuring a trigger
- Zabbix 7.0 Manual: Zabbix agent 2 templates
- PostgreSQL by Zabbix agent 2 (README, release/7.0)
- Zabbix 7.0 Manual: PostgreSQL plugin
- Zabbix 7.0 Manual: ODBC monitoring
Zabbix prices, steps and screens were checked on the official site on November 3, 2026. Check the official site for the latest information. Zabbix is a trademark of Zabbix LLC.